Historical Context: 2026 Is Outperforming the Average Midterm Year
Jeffrey L. Corliss, CFP®, ChFC®, CLU® CASL®
Managing Director
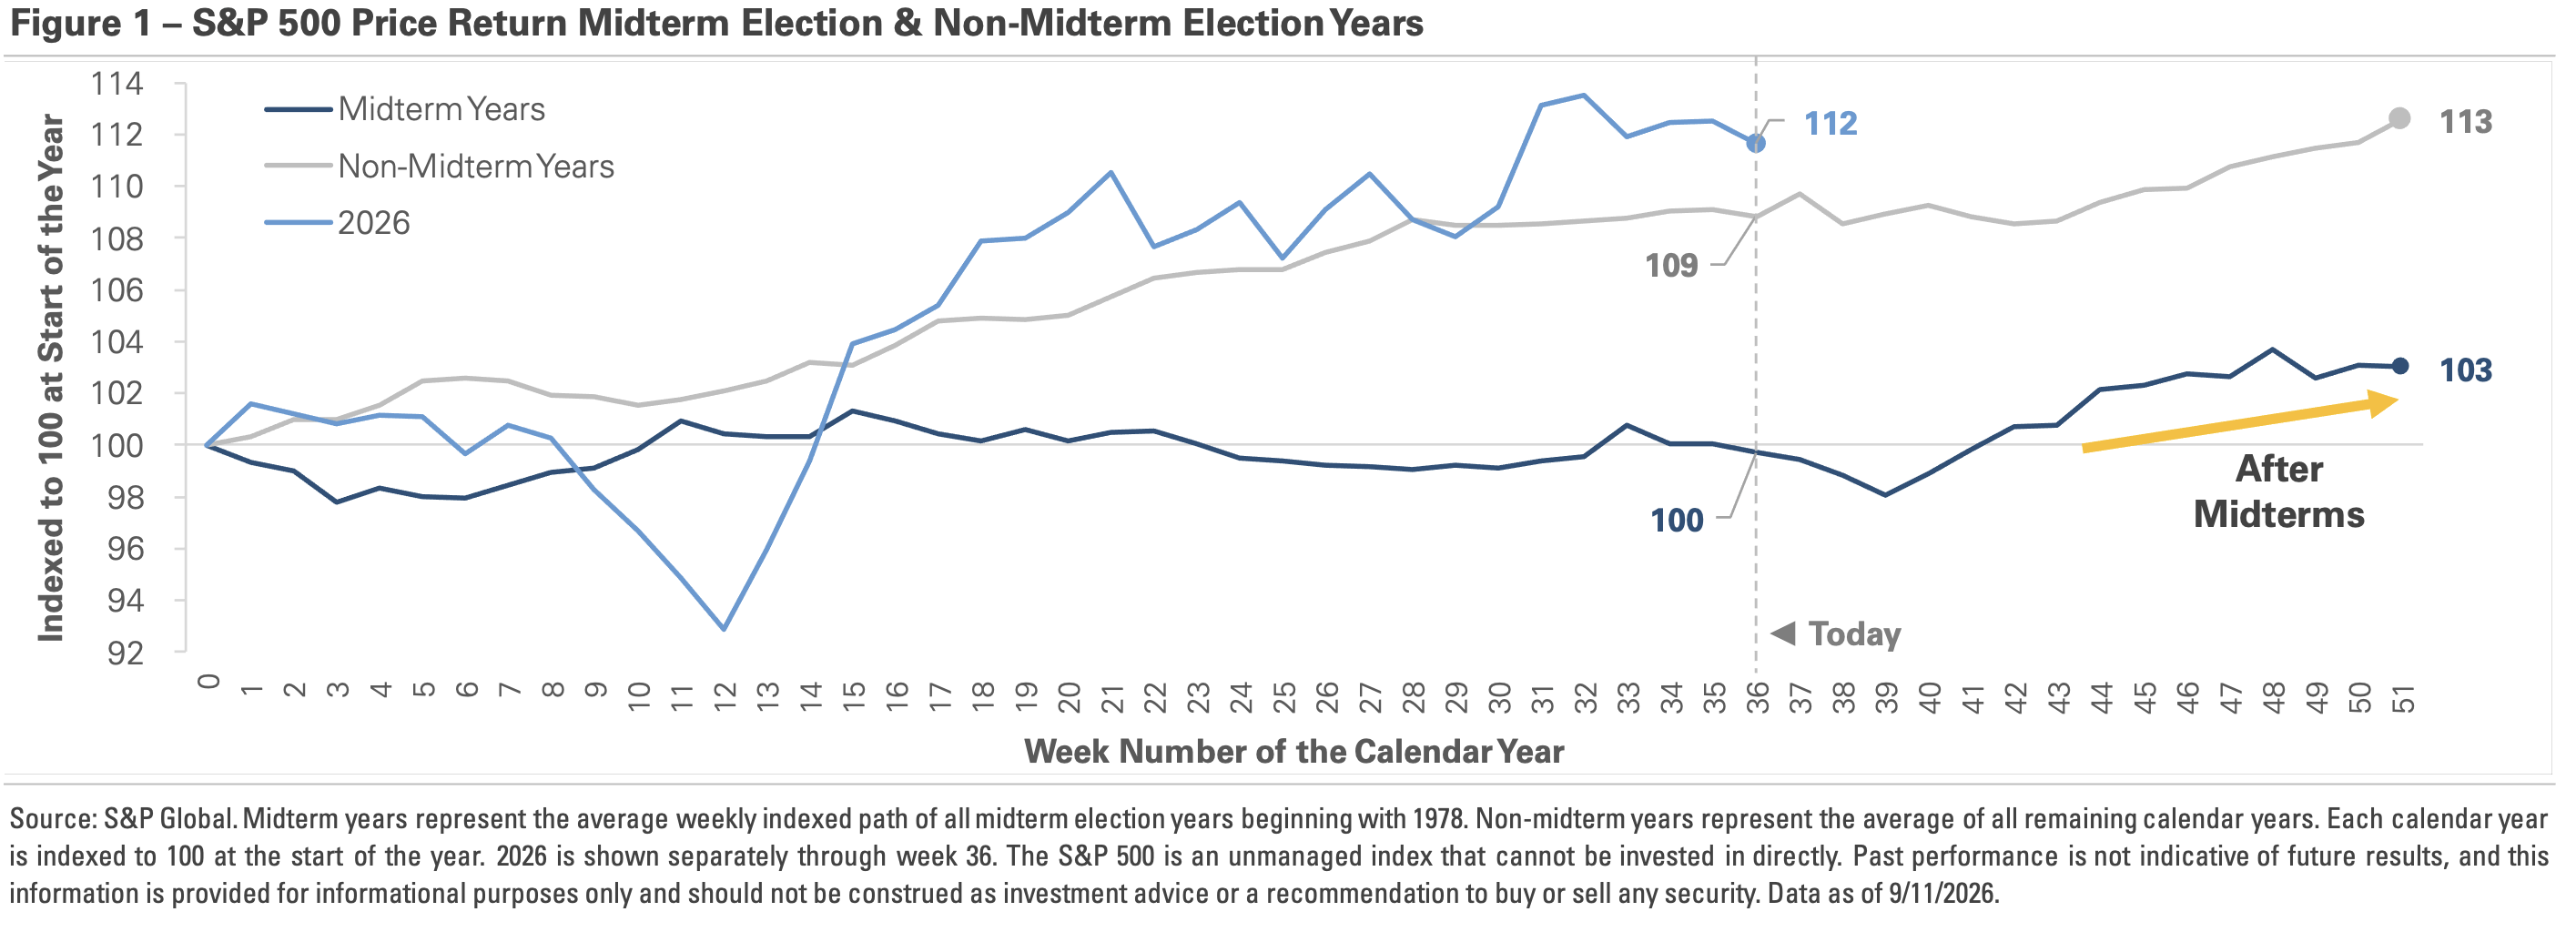
Midterm election years have historically been more volatile than other years, and they’ve historically delivered weaker returns. This year has followed a very different path. The S&P 500 has gained nearly +12% year-to-date. For comparison, the average midterm year is historically flat at the same point, while the average non-midterm year is up nearly +9%. This year has outperformed not only the typical midterm year but also the average non-midterm year. The chart below compares the S&P 500’s year-to-date price return against the average return path of midterm and non-midterm years since 1978, with each year indexed to 100 at the start of the year.
The explanation for the historical midterm pattern is that these years carry an unusual amount of policy uncertainty around future taxes, spending plans, and regulatory changes. Investors generally dislike unresolved questions. Markets have been volatile this year, but the source has been geopolitical and macroeconomic rather than electoral. The S&P 500 fell -5% in Q1 before rebounding more than +20%. Geopolitical tensions have contributed to sharp moves in oil prices, long-term Treasury yields have climbed to multi-decade highs, and uncertainty around the Federal Reserve’s policy has repeatedly shifted the outlook for interest rates. The volatility midterm years are known for has appeared, but the election calendar hasn’t been the cause, and the weak returns haven’t followed either.
The chart also shows markets have historically traded higher once the election passes and attention returns to earnings and economic growth. Those fundamentals have driven the market this year. Strong corporate earnings have helped support the stock market’s valuation. Artificial intelligence investment has fueled spending on data centers, computer chips, software, and power infrastructure, supporting both company profits and broader economic growth. The economy has also continued to expand, supported by steady consumer spending and business investment. None of these drivers depend on an election outcome. Corporate earnings, interest rates, and consumer demand operate on their own timelines.
This year’s divergence from the historical midterm pattern is a useful reminder of the limits of market averages. An investor could have entered 2026 knowing that midterm years have historically produced more volatility and weaker returns. Expecting a difficult market would have been reasonable. The mistake would have been treating that historical average as a return forecast. Historical patterns are useful because they show what markets have tended to do under similar circumstances. They are less useful when the average becomes a prediction for a single year. The takeaway: Use history as context for what might happen along the way, but don’t use it as a forecast of where you’ll end up.
This material is for general information and educational purposes only. Information is based on data gathered from what we believe are reliable sources. It is not guaranteed as to accuracy, does not purport to be complete and is not intended to be used as a primary basis for investment decisions.
Find answers to your questions about Hightower Signature Wealth
Hightower Signature Wealth is a fiduciary wealth management practice that provides investment management, financial planning, estate strategies, insurance, and banking solutions. We work with families, business owners, professionals, women, and retirees across more than 40 offices nationwide. Our advisors take the time to understand your financial priorities, develop a plan around your goals, and adjust that plan as your life and circumstances evolve.
Hightower Signature Wealth provides a broad range of wealth management services designed to address different aspects of your financial life. Our capabilities include investment management, financial planning, retirement planning, estate strategies, insurance and risk management, banking solutions, and charitable giving strategies. By considering these areas together, our advisors can develop a coordinated approach based on your goals, priorities, financial circumstances, and plans for the future.
Hightower Signature Wealth advisors work with a broad range of clients, including women, families, business owners, professionals, retirees, and high-net-worth individuals navigating major life or financial transitions. Rather than applying a generic playbook, each advisor tailors the plan to a client’s specific goals and current stage of life – from early-career decisions to multigenerational wealth transfer.
Yes. Hightower Signature Wealth advisors serve as fiduciaries, which means they are committed to acting in their clients’ interests when providing investment advice. We offer fee-based advisory services, with fees depending on the services provided and the specifics of your relationship. Your advisor will discuss the applicable fee structure with you so you can understand how you are charged and what services are included.
Hightower Signature Wealth has more than 40 offices nationwide, allowing our advisors to serve individuals, families, and organizations across the country. Depending on your location and preferences, you may be able to work with an advisor locally or connect with a team in another market. Visit our Locations page to explore our office locations, learn more about the teams in each market, and find an office near you.
Getting started with Hightower Signature Wealth is simple. Complete our online contact form with some basic information about yourself and what you are looking for, and we’ll connect you with an advisor who can discuss your needs and financial priorities. That initial conversation is an opportunity to learn more about our approach, ask questions, and determine whether working with a Hightower Signature Wealth advisor may be a good fit.
Your first conversation is an opportunity for us to learn more about you, your financial circumstances, and what you hope to accomplish. An advisor may ask about your goals, current investments, family considerations, business interests, and other priorities that could influence your financial plan. You’ll also have an opportunity to ask questions, learn about our approach, and discuss what working together could look like.